

The idea for this post came from the picture above. As you can see, the fastest population growth in the United States has been in southern and western states, led by Nevada, Arizona, and Florida. Northern and central states have grown much more slowly, and West Virginia’s population even shrank a little bit. In the following charts, I’ve graphed the data above, and added in Canadian provinces, Mexican states, and Caribbean countries to provide further points of comparison.
The x-axis shows population growth between 1950-2016 in percentage terms, the y-axis shows total population size as of 2016 (in millions).
This first chart shows just American states and Canadian provinces:
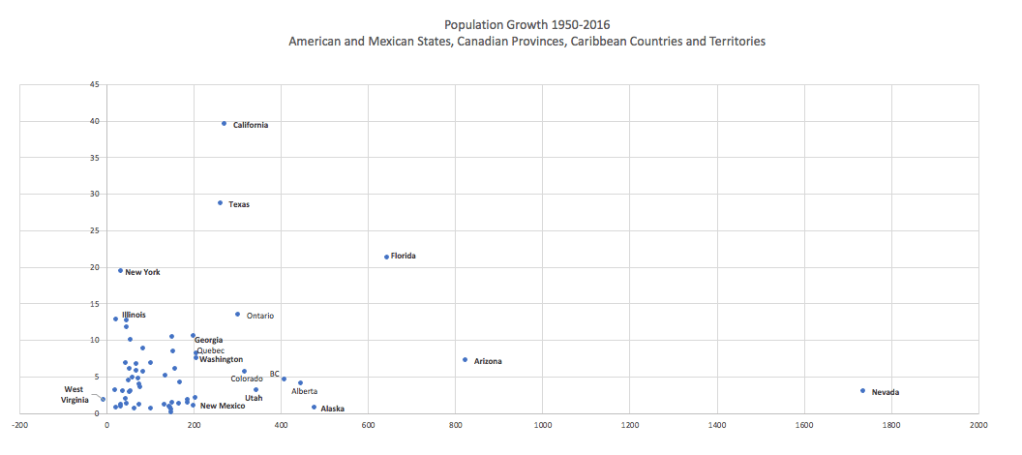
The big standouts in the US are California, Texas, Florida, Arizona, and Nevada. In Canada too, the southernmost province, Ontario, and the westernmost provinces, Alberta and British Columbia, grew the fastest. But, Canadians not having a proper Sunbelt to move to, even Quebec’s growth rate was faster than all but nine US states.
Now let’s add in Caribbean and Central American countries, and Puerto Rico:
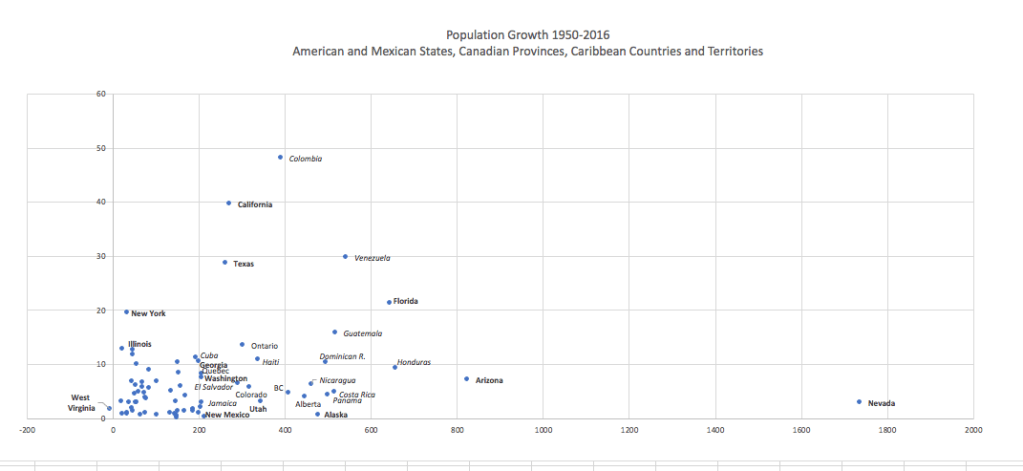
The populations of these countries grew faster than most American states, though none matched the growth of Arizona or Nevada. The most notable standouts were Colombia, Venezuela, Honduras, and Guatemala; the Caribbean islands grew more slowly.
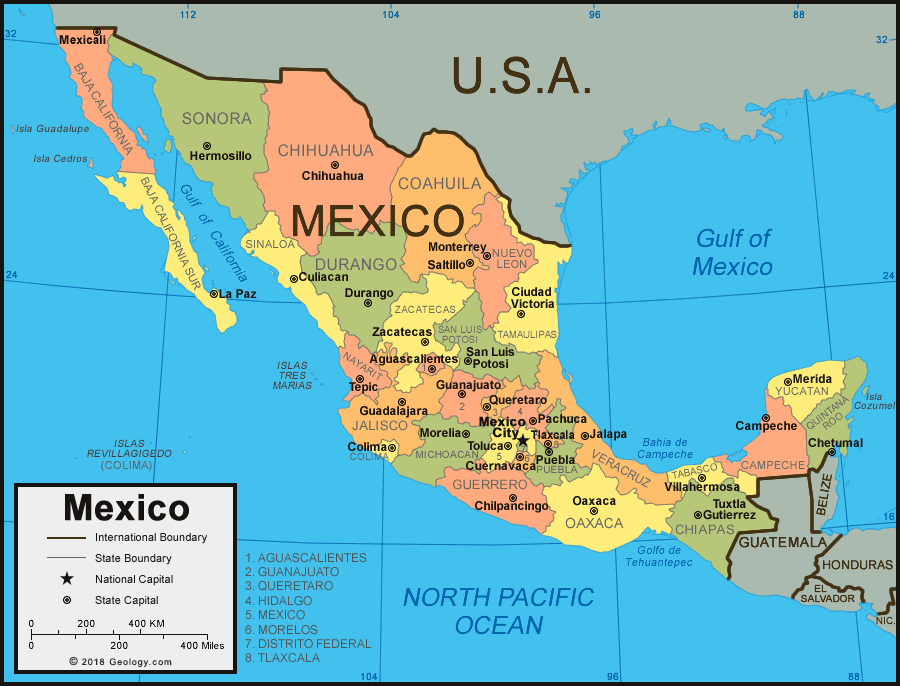
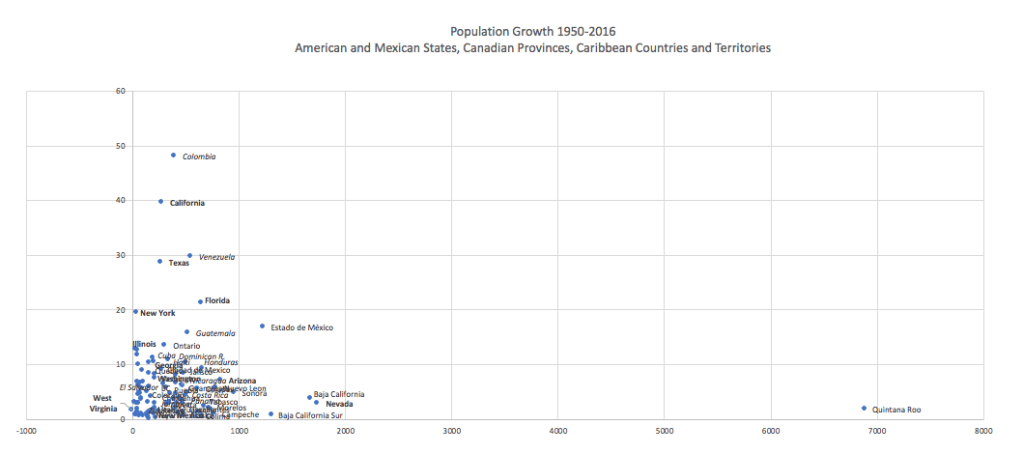
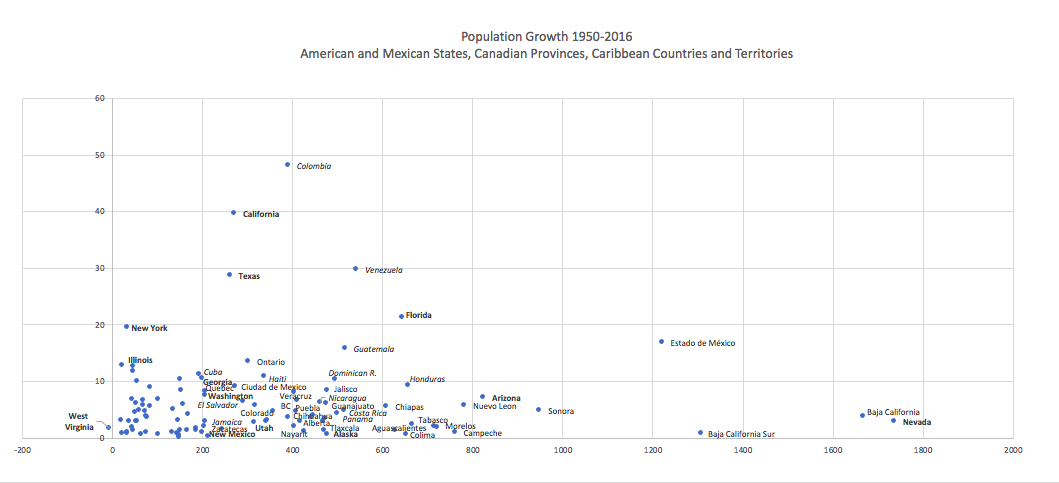
Now let’s add in the Mexican states. Mexico has 32 states, but the following chart shows only 29 of them; I could not find the relevant statistics for the states Oaxaca or Durango, and did not include the state of Quintana Roo here because its growth has been so incredibly rapid since Cancun was developed in the 1970s that to include it would have distorted the entire chart. (You can see what that looks like further below).

As with the Caribbean and Central America, Mexican states have grown faster than American ones. As in the US, the fastest-growing Mexican states have tended to be near the US-Mexico border, and near California and Arizona in particular. These include the two Baja California’s, Sonora, and Neuvo Leon.
The big standout, however, is Estado de Mexico (State of Mexico), which includes part of Mexico City. In contrast, Ciudad de Mexico, which includes the historic centre of Mexico City, had one of the slowest-growing populations. This is similar to America’s District of Columbia, the population of which has actually shrunk since its peak in 1950, even as the population of Washington’s metropolitan area in Virginia and Maryland has grown relatively quickly.
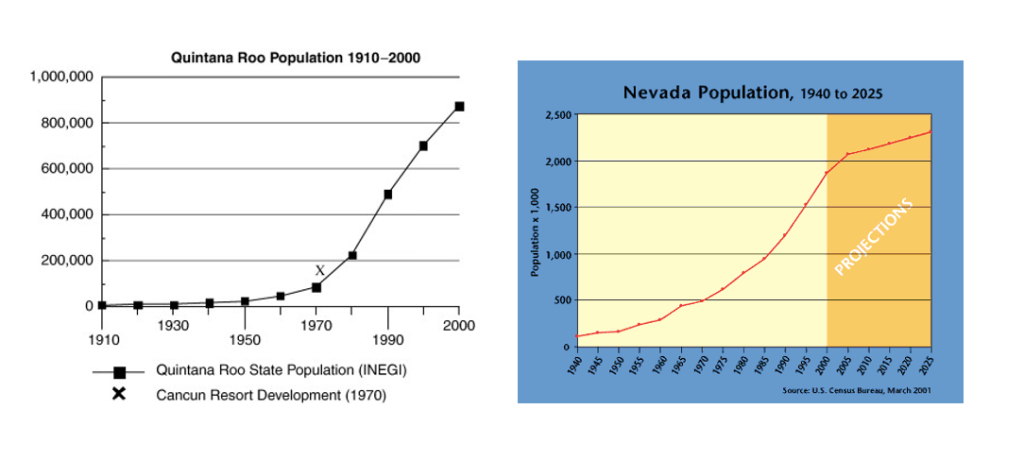
Now, let’s add in the outlier that is Quintana Roo. Its growth, based on Cancun, is similar to Nevada’s Vegas-driven growth. But whereas Nevada’s population in 2016 was around 17 times larger than it was in 1950, Quintana Roo’s was nearly 70 times larger than it was in 1950:
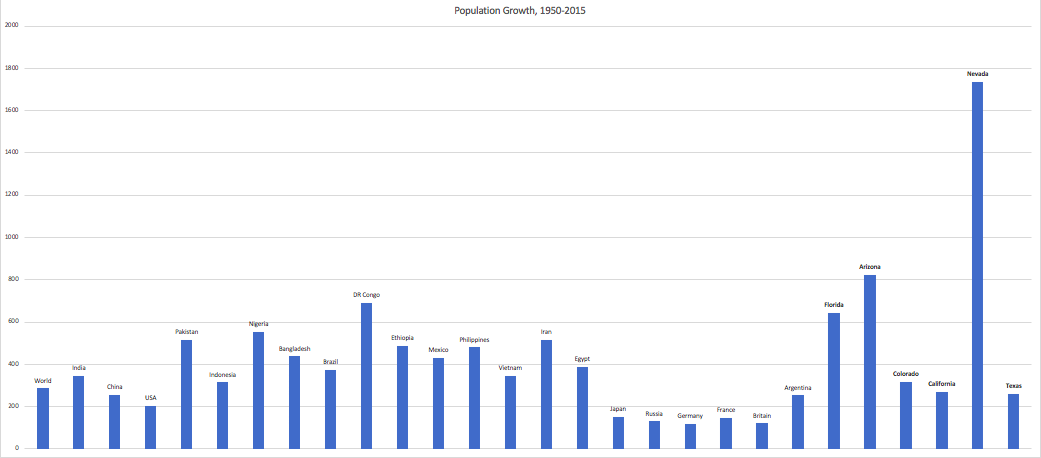
Finally, let’s compare the growth of US states to countries worldwide. Here is the population growth percentage of some of the biggest countries in the world, compared to five of the fastest-growing American states:

This may just be a coincidence but, as in the US where desert states like Arizona and Nevada have grown the fastest, so too in the world have desert countries grown the fastest:

While Nevada’s growth rate has been about the same as Kuwait’s, the comparison between sin cities Las Vegas and Dubai (in the United Arab Emirates, the biggest growth outlier in the world) might be the most apt.

One Reply to “”