At the 20th National Congress of the Chinese Communist Party last month, hundreds of Chinese officials were elevated to new positions within the Party hierarchy. This gives us a chance, among other things, to look at where in China its politicians were born, to see if any regional patterns stand out.
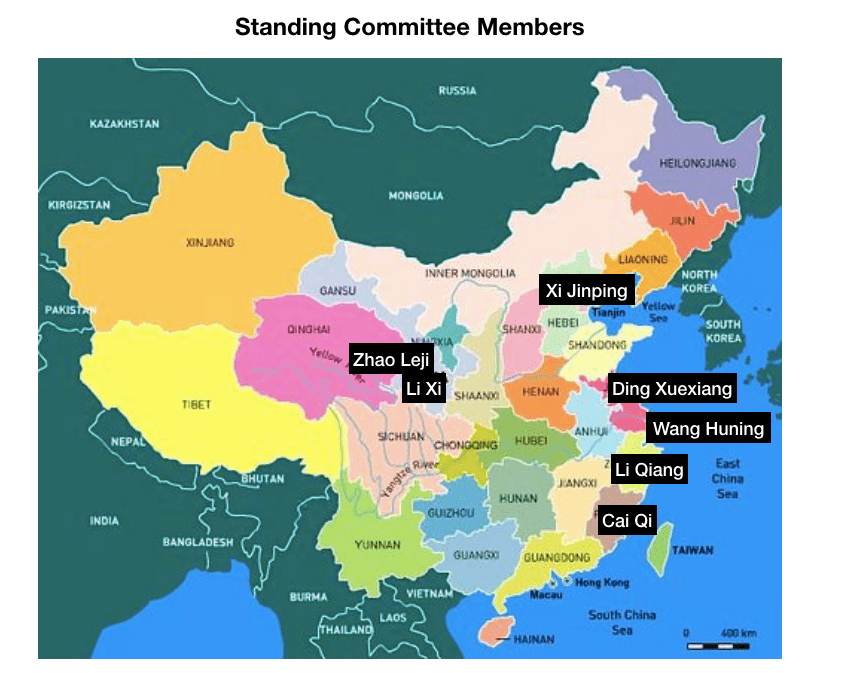
Let’s start with the members of the Politburo Standing Committee, the highest-ranking group in the Party:
Next is the Politburo, which now has 24 members, including the seven Standing Committee members:
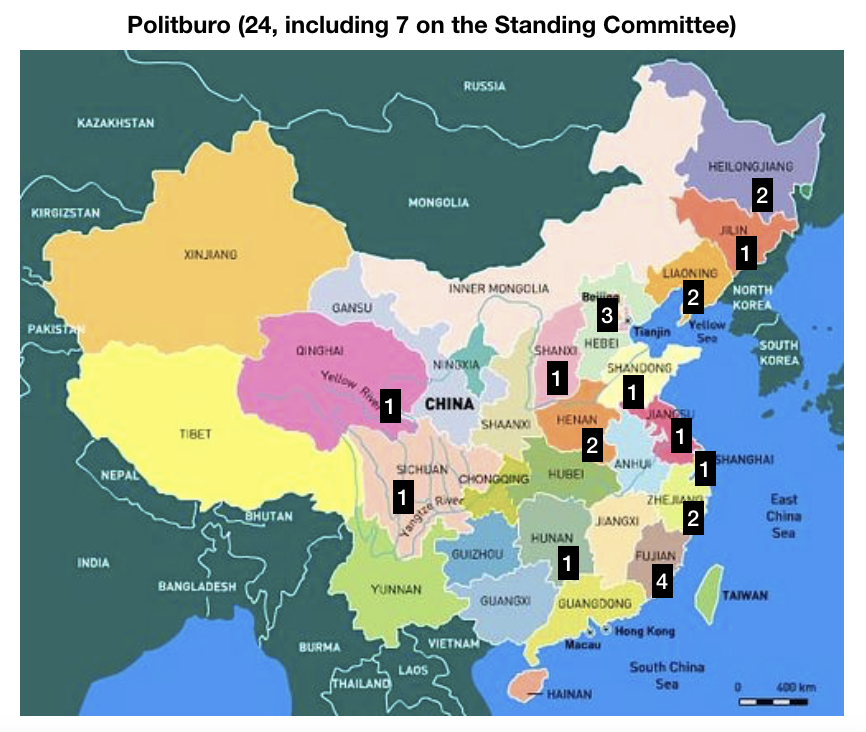
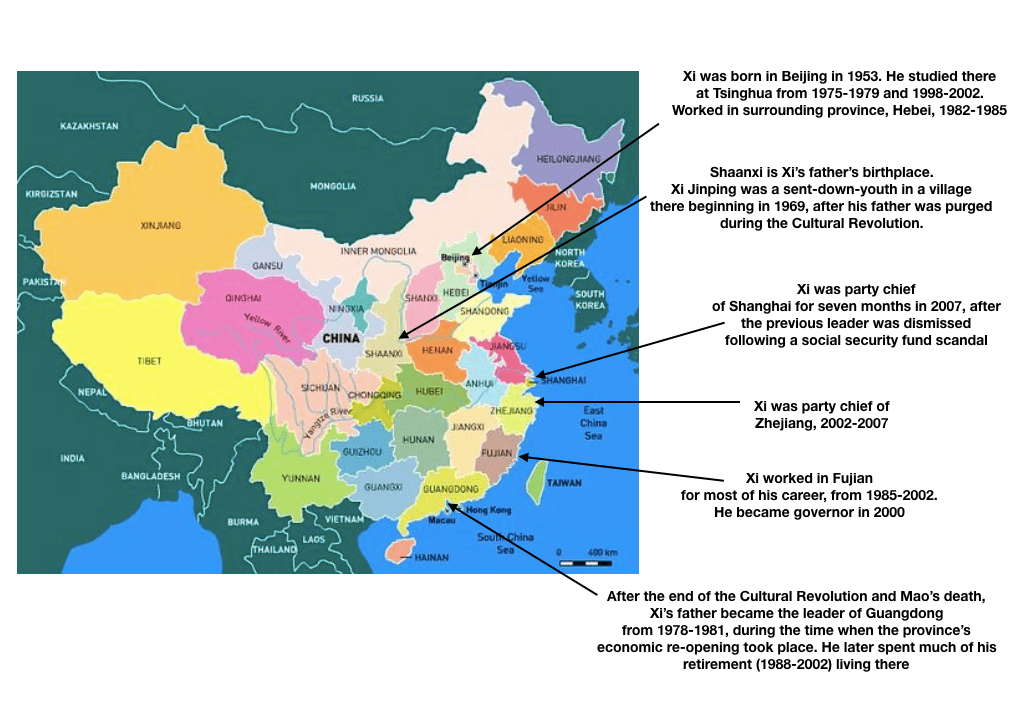
Three Politburo members (including Xi) were born in Beijing; four were born in Fujian, where Xi spent 17 years of his career before becoming general secretary of the Party in 2012:
Beyond the Politburo, there is the Party Central Committee, which currently has 205 full members, roughly two-thirds of whom made it on to the Central Committee for their first time this year. I was able to find the birthplaces for 194 of those 205; the 11 I couldn’t find I will list below:
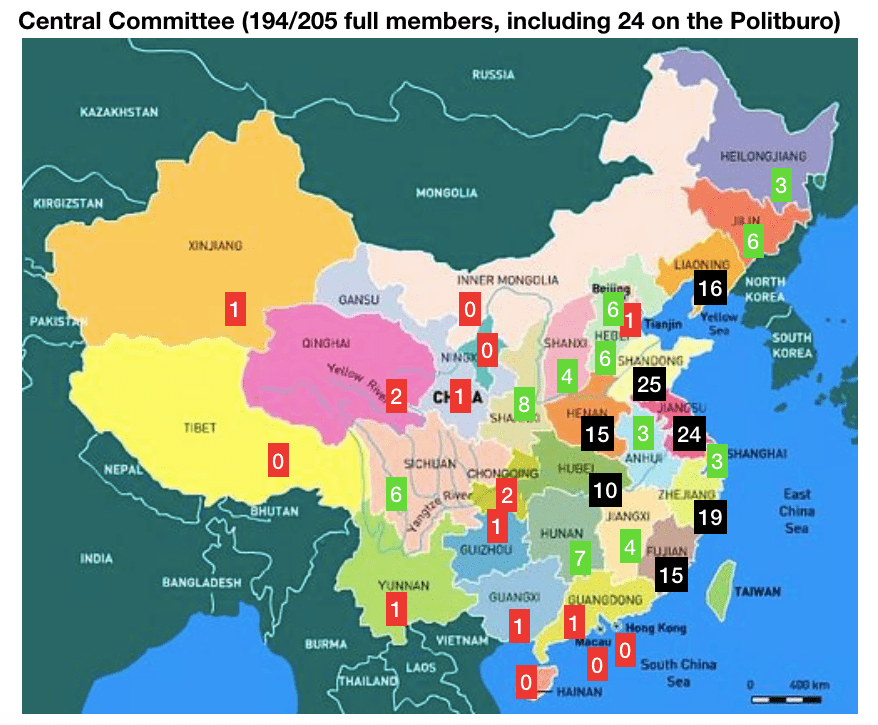
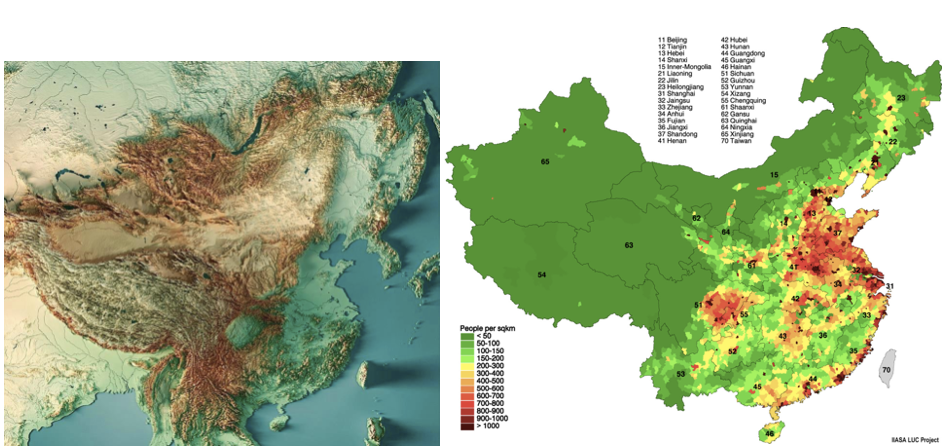
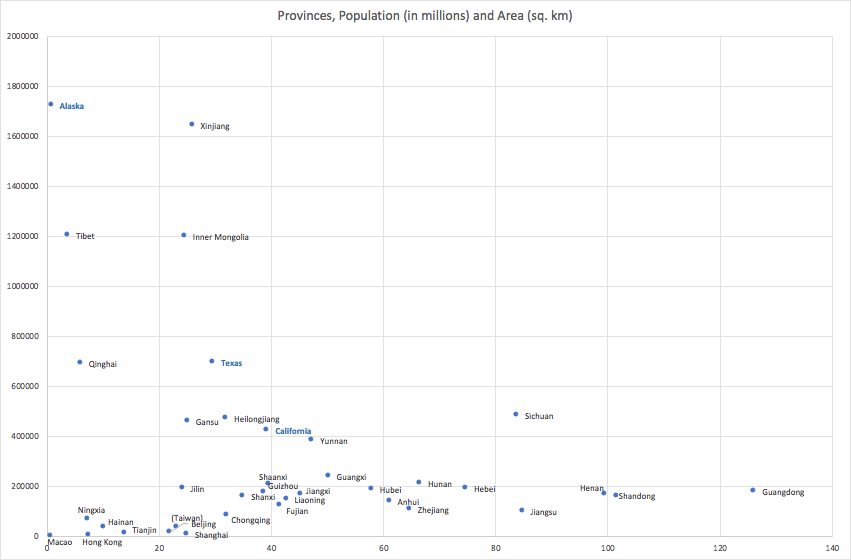
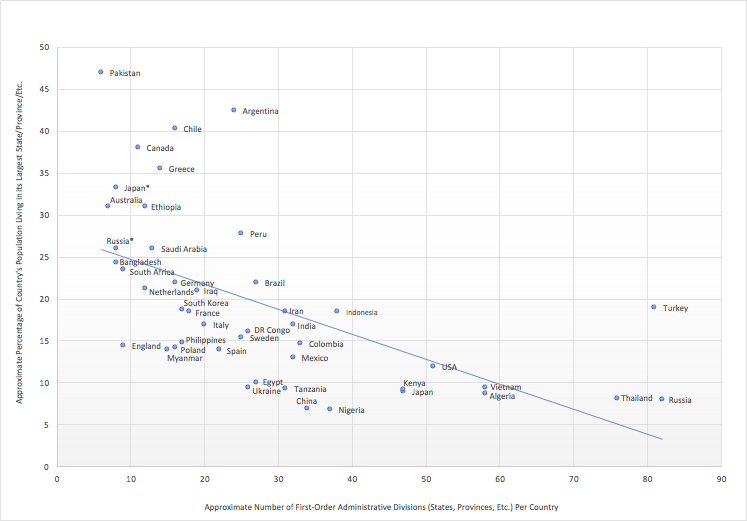
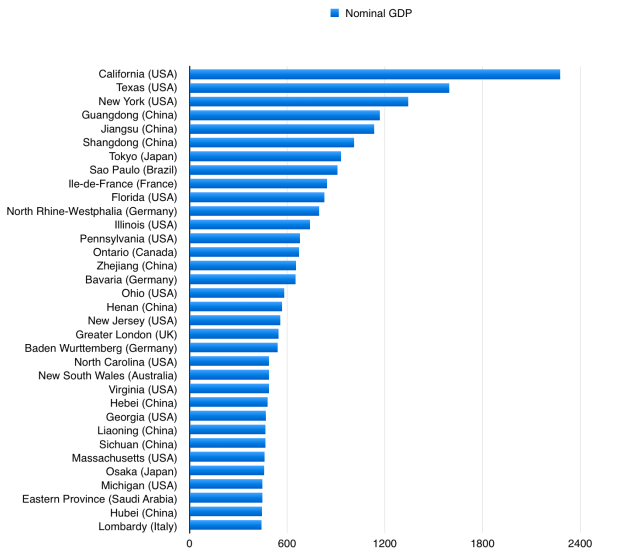
Most Politburo and Central Committee members were born in eastern or northern China – where most of China’s population lives – whereas far fewer were born in the country’s western or southern provinces, even where those provinces have large populations. See for example the difference between China’s most populous province, Guangdong, which is in the southeast, and China’s second most populous province, Shandong, in the northeast. Only 1 of these 194 politicians were born in Guangdong, whereas 25 of them were born in Shandong, and 24 were born in Shandong’s neighbour Jiangsu.
People born in provinces like Guangdong were highly under-represented on the Central Committee. This is true even after adjusting for the fact that Guangdong had not yet become the most populous Chinese province 50-70 years ago, when most of the current Committee members were born:
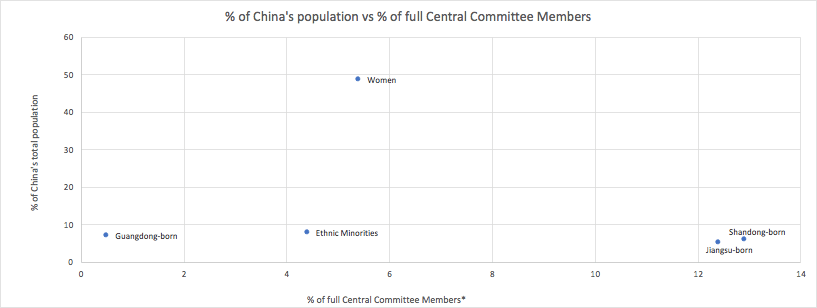
Part of the reason for the under-representation of provinces like Guangdong might be that when the current leadership generation was young, fewer people in these provinces spoke Standard Northern Mandarin as do today. In other words, these outcomes could be the result of regional differences that existed in the past, which no longer exist to nearly the same extent today, yet linger in the form of Party personnel simply because almost all of its top positions are filled by older men.
On the other hand, perhaps the under-representation of high-ranking officials born in certain provinces does reflect ongoing regional differences within the Party system, in which, roughly speaking, the north and east is the dominant political core of the country, in comparison to the deep south or west. Or maybe there are other explanations for these differences that are only indirectly related to politics, reflecting regional economic or cultural traits that have led people toward certain careers.
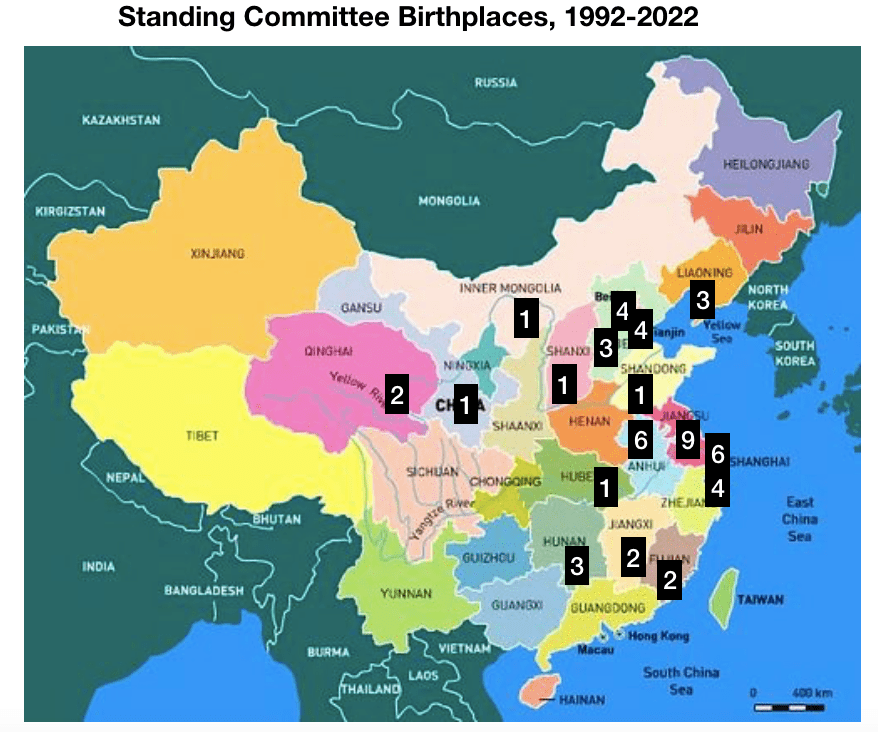
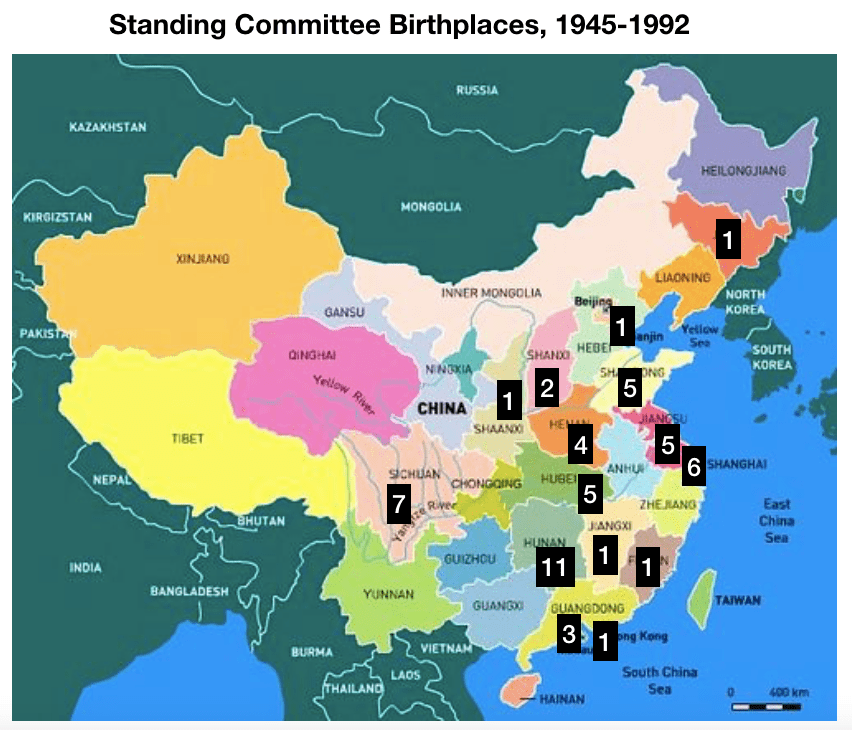
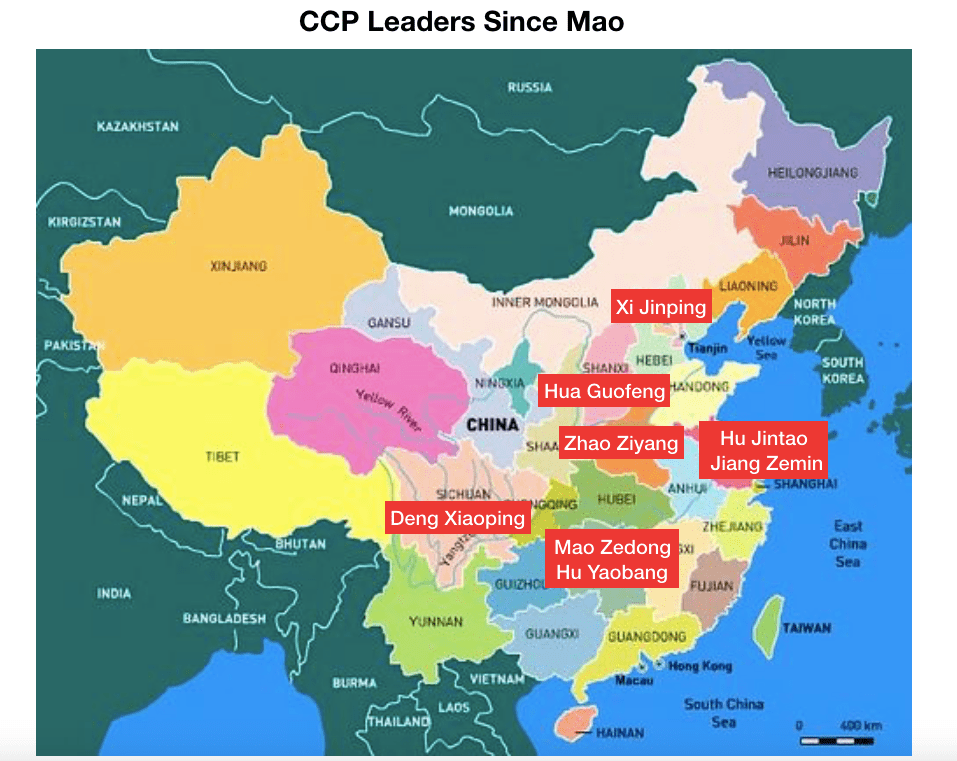
Looking back at all of the Standing Committee members over the course of the past three decades, the same basic pattern holds, with the north and east predominating and the south and west unrepresented. Even for some of the most populous provinces like Guangdong and Sichuan, or for that matter Henan (the populous but poor interior state in north-central China), there have been zero Standing Committee members appointed at any of the past six party congresses who were born in those provinces.
Similar patterns might also hold true more widely, for Politburo and Central Committee membership over the past generation. According to an article by Cheng Li:
“Southern China has been grossly underrepresented on both the 18th and 19th Central Committees (CCs), holding only one and two percent of seats, respectively, even though the region makes up 12 percent of China’s population and 13 percent of its GDP. There was not a single representative from Guangdong — despite it being China’s richest and most populous province — among the 205 full members of the 18th CC, and there is only one full member representing the province on the 19th CC: Minister of Human Resources and Social Security Zhang Jinan (1957), who was born in Guangdong. Zhang is expected to retire from his ministerial position soon.Like the 18th Politburo, no current Politburo members were born in the southern or southwestern regions, which together make up more than a quarter of China’s population and more than 20 percent of the country’s GDP. The absence of Cantonese and Sichuanese representatives in the two recent Politburos sharply contrasts with the early years of the reform era when the country was largely led and influenced by heavyweight leaders from Guangdong (like Ye Jianying) and Sichuan (like Deng Xiaoping, Yang Shangkun, and Yang Baibing).”
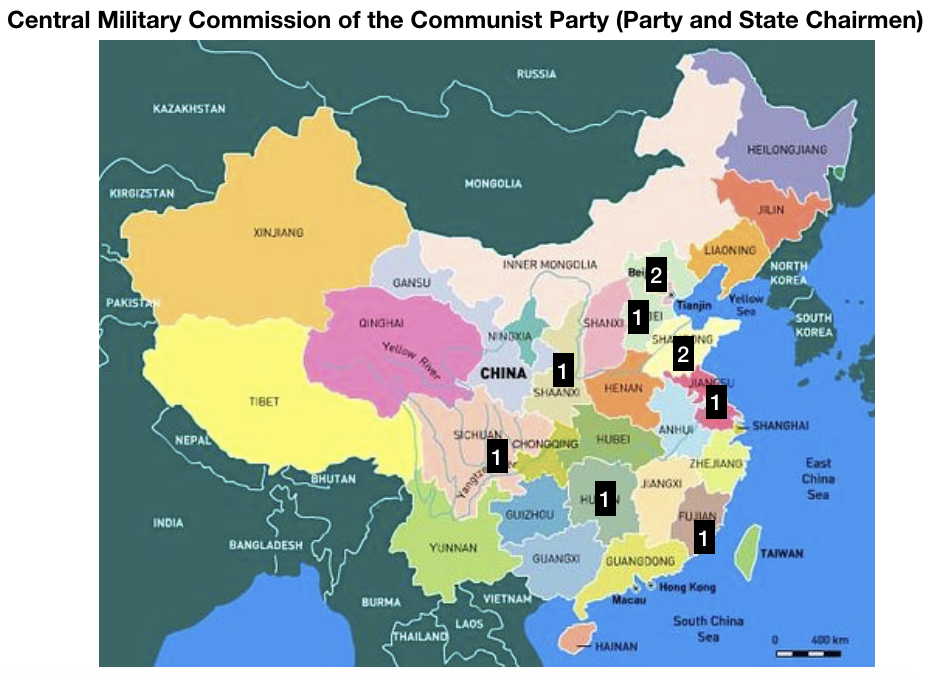
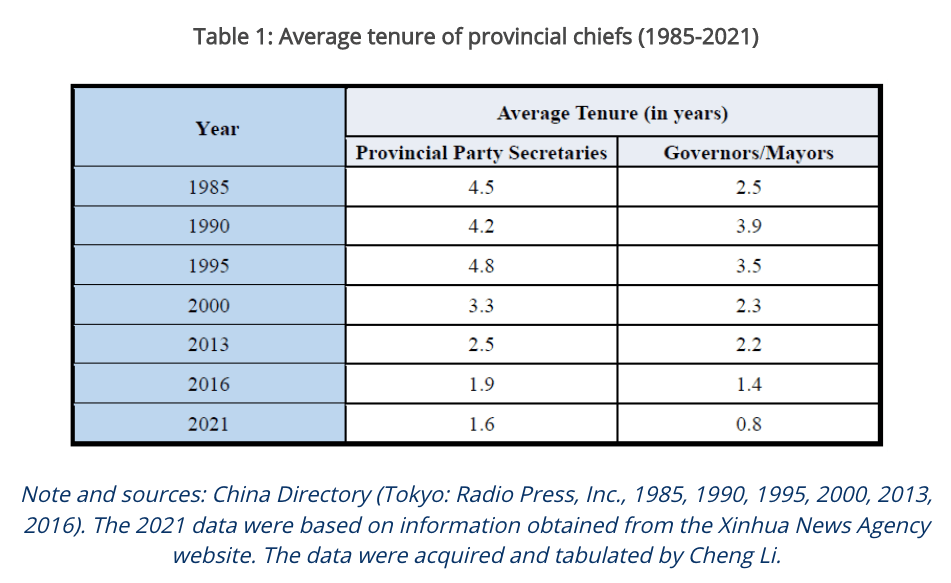
Whatever the reasons are for it, similar regional patterns hold, to varying degrees, in the birthplaces of China’s new Central Military Commission chairmen, and in the birthplaces of China’s provincial party chiefs (aka party secretaries) and government chiefs (aka provincial governors, mayors of municipalities, chairpersons of autonomous regions, or chief executives of special administrative regions):
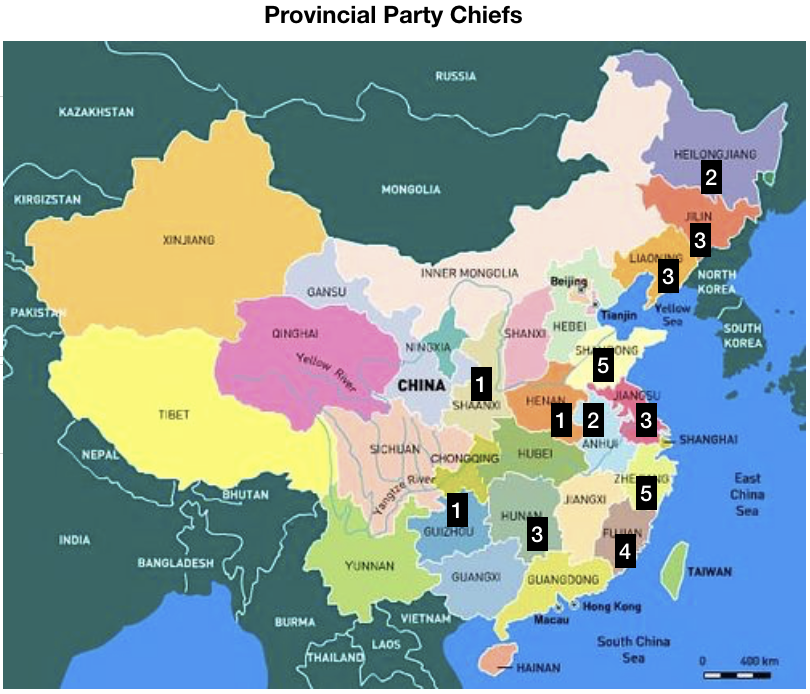
As for provinces like Guangdong, no current provincial chiefs were born there, and there has not been a native-born party chief there since Xie Fei, a Politburo member, in 1998. And yet the party chiefs of Guangdong have mostly been significant political figures. All but one of the past five of them since 1998 have joined the Politburo Standing Committee. (The exception, Hu Chunhua, was snubbed last month: not only was he not added to the Standing Committee as had been expected, but he also lost the spot he had held in the Politburo). Most recently Li Xi, Guangdong party chief from 2017-2022, was elevated to the Standing Committee, and now serves as the head of China’s anti-corruption department (replacing Wang Qishan, who was himself a vice-governor of Guangdong earlier in his career). The current party chief of Guangdong, who just started the job in October 2022, is Huang Kunming, who previously worked with Xi Jinping both in Fujian (Huang’s birth-province) and in Zhejiang.
[The other three 21st century Guangdong party chiefs added to the Standing Committee were Li Changchun, Wang Yang, and Zhang Dejiang. Among a number of important roles, Wang and Zhang also served as the party chiefs of Chongqing immediately before and after Bo Xilai; Zhang was also party chief of Zhejiang immediately before Xi Jinping, and then went to Guangdong just after the SARS outbreak began there; Wang meanwhile was the politician most associated with the relatively liberal “Guangdong model” of development].
Earlier still, major figures who served as Guangdong party chief include Zhao Zhyiang, who later became the Party’s General Secretary until he supported the 1989 student protests; Xi’s father Xi Zhongxun, who became Guangdong’s party chief after the Cultural Revolution and presided over the province’s economic re-opening, then later spent his retirement living there; and marshal Ye Jianying, Guangdong’s first party chief and governor in the Communist era, who was born in Guangdong and who later became the top military leader involved in overthrowing the Gang of Four and backing Deng Xiaoping after the Cultural Revolution.
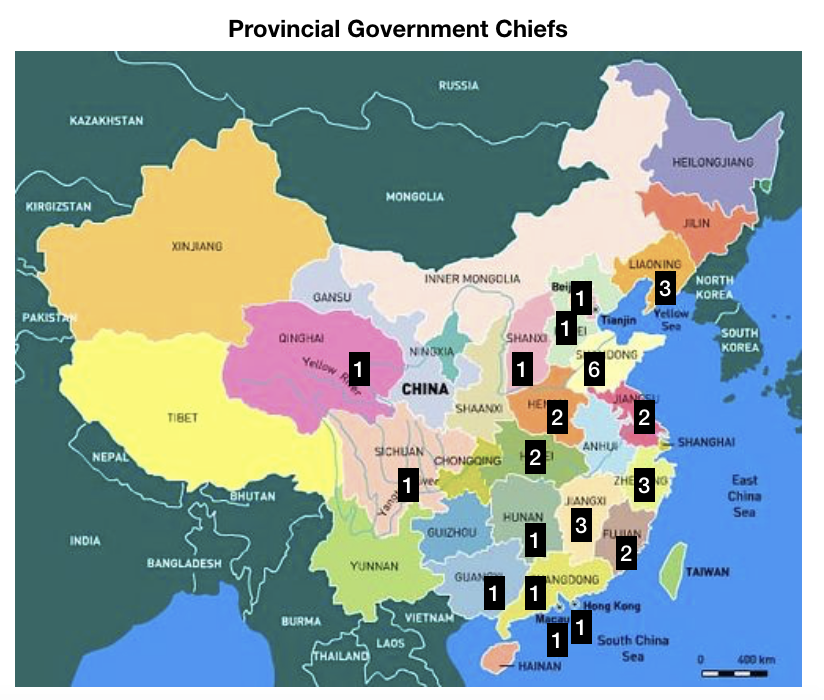
To focus yet again on Guangdong, the only Guangdong-born governor at present, Lan Fo’an, is the governor of Shanxi provice. He previously worked for the Central Commission for Discipline Inspection, the unit of the Party in charge of the anti-corruption campaign. Conversely, the governor of Guangdong is Shanxi-born: Wang Weizhong, who was previously the party chief of Shenzhen, and before that was the party secretary of Taiyuan, Shanxi’s capital, in 2016, following the especially intense anti-corruption campaign there. Wang replaced Ma Xingrui (born in Heilongjiang), Guangdong’s governor until the end of 2021, who has gone on to become party chief of Xinjiang.
In contrast, all three of the governors of Guangdong who preceded Ma, from 1996-2016, were born in Guangdong, and spent their entire careers there. Before that, Ye Xuanping (the son of Guangdong’s first party chief and governor, marshal Ye Jianying) was governor of Guangdong, his native province, from 1985-1991, and mayor of Guangzhou (Guangdong’s capital, one of China’s major cities) from 1980-1985. [A more recent Guangdong-born mayor of Guangzhou, Wang Qiangliang, was one of the higher-ranking figures brought down by the anti-corruption campaign in 2014. Guangzhou’s current mayor is a northerner, who took up the job at the beginning of this year following the simultaneous resignation of the city’s previous (Guangdong-born) mayor Wen Guohui and (Hunan-born) party chief Zhang Shuofu]. Previous native-born governors of Guangdong, Chen Yu and Ye Jianying, served from 1948-1953 and 1957-1967. Serving between them was Tao Zhu, from neighbouring Hunan; it was only in 1969 that a northern-born governor was first appointed to the province.
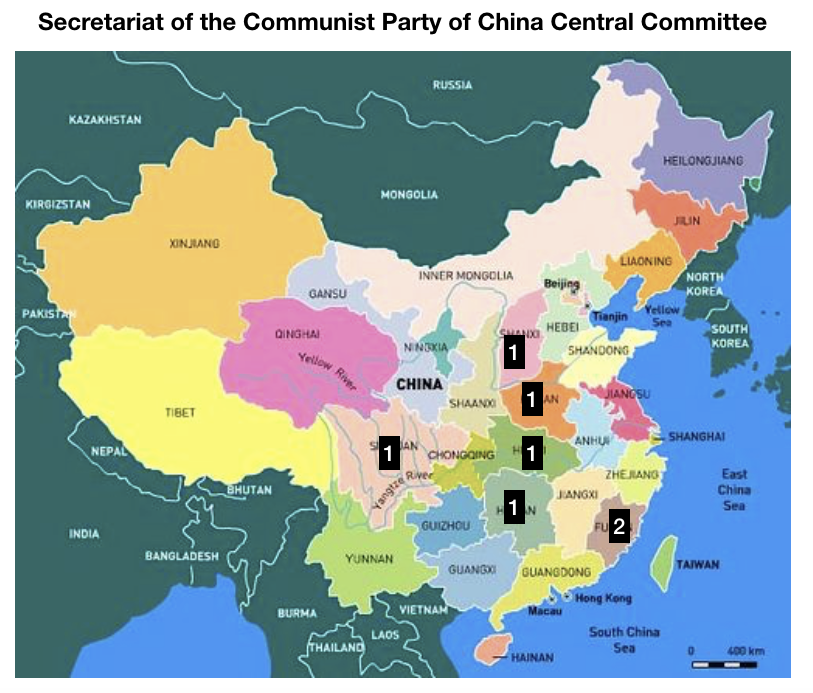
The high-ranking central secretariat of the Party Central Committee has a different regional pattern, with none of its secretaries born in coastal provinces apart from Fujian. But with only seven secretaries, it is a small sample size:
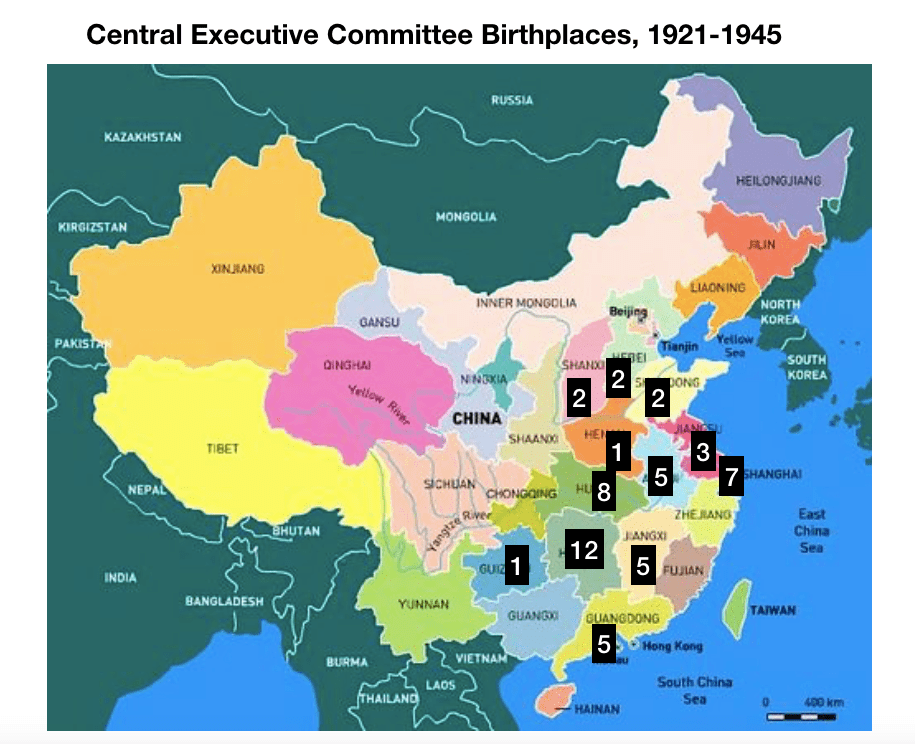
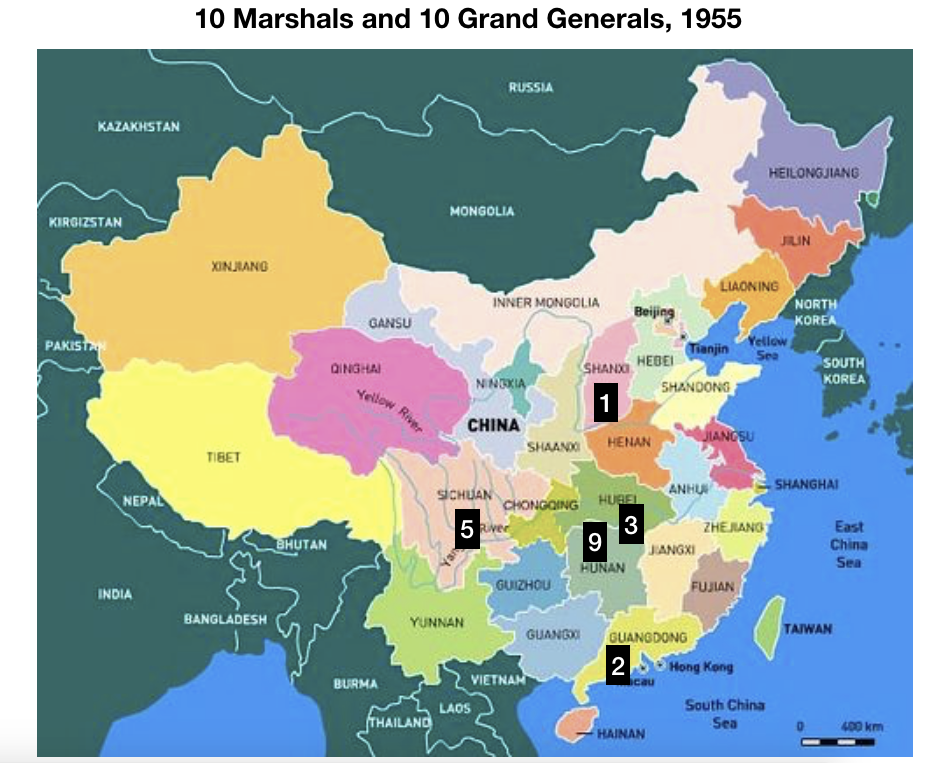
The birthplaces of the earlier, revolutionary era of the Party leadership also show a different pattern, in which the north and the east do not predominate, Guangdong is not un-represented, and Hunan province in particular (Mao’s birthplace, among others) figures highly:
I’ll end by quoting a third article by Cheng Li:
“Over the last century, the Chinese national leadership often disproportionately recruited elites from certain geographic regions that were perceived to be important in each period. When Sun Yat-sen, a Cantonese native, founded the Republic of China after the Revolution of 1911, his fellow Cantonese, especially those who attended the Whampoa Military Academy in Guangzhou, comprised a significant portion of the political and military elite during the first couple of decades of the Republic. Similarly, when Chiang Kai-shek controlled the nationalist government in the 1930s and 1940s, his fellow Zhejiang Province natives occupied some of the most important posts in the government, including military and intelligence operations. As for the Chinese Communist Party (CCP) cadres, most veteran leaders, known as “Long Marchers,” came from central China –– Hunan and Hubei provinces, in particular. This geographic orientation was mainly a result of the origins of the Chinese Communist movement in the 1920s and 1930s, as initial support came from peasants in these areas. Many peasants-turned-revolutionary soldiers later became national leaders of the newly founded People’s Republic of China (PRC). Approximately 41 percent of the members of the Eighth Politburo of the CCP formed in 1956 were born in Hunan, and about one-third (33 percent) of the members of the Ninth Politburo in 1969 were born in Hubei. Altogether, leaders from provinces in central China occupied more than half of the Politburo seats in each of these two Party Congresses (59 percent and 52 percent, respectively). The “gang of four” (sirenbang) leaders who came to prominence in the 1960s and 1970s, especially toward the end of the Cultural Revolution, were largely from Shanghai. They wielded enormous power and influence over the country in the final years of the Mao era, when they promoted many fellow Shanghai natives to important positions. Under the leadership of both Jiang Zemin and Hu Jintao, China experienced disproportionate representation of leaders from the east coast, with large contingents hailing from Shandong and Jiangsu provinces. On the 15th CC in 1997, about 45 percent of full members were born in eastern China. According to a study of military elites in the 1990s, well over one-quarter of high-ranking officers in the People’s Liberation Army (PLA) came from Shandong Province, and altogether 52 percent of China’s top military officers were from eastern China.”


